You will be shocked at how easy it is to trade Bitcoin and win every single time. The Bitcoin time-based chart is the only chart you will ever need to master trading the Bitcoin 4-year cycle.
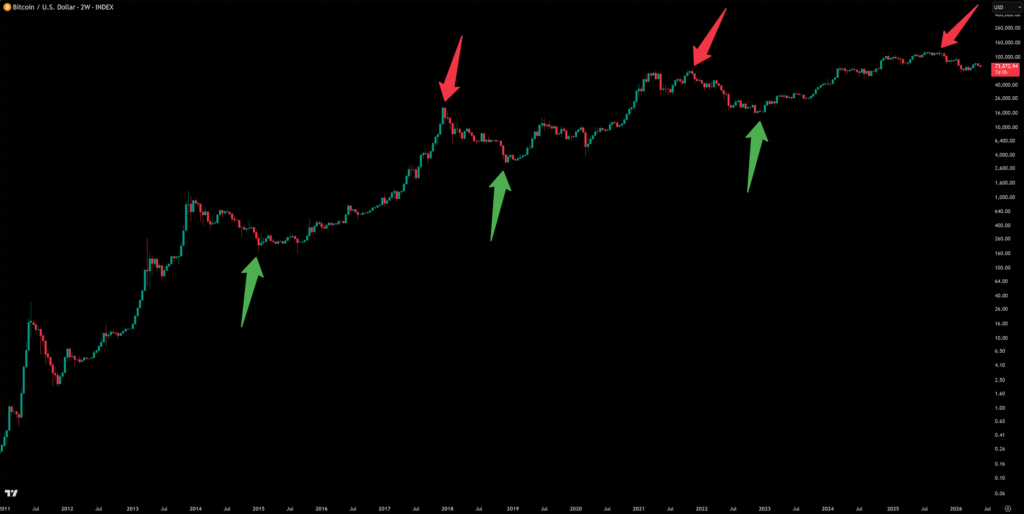
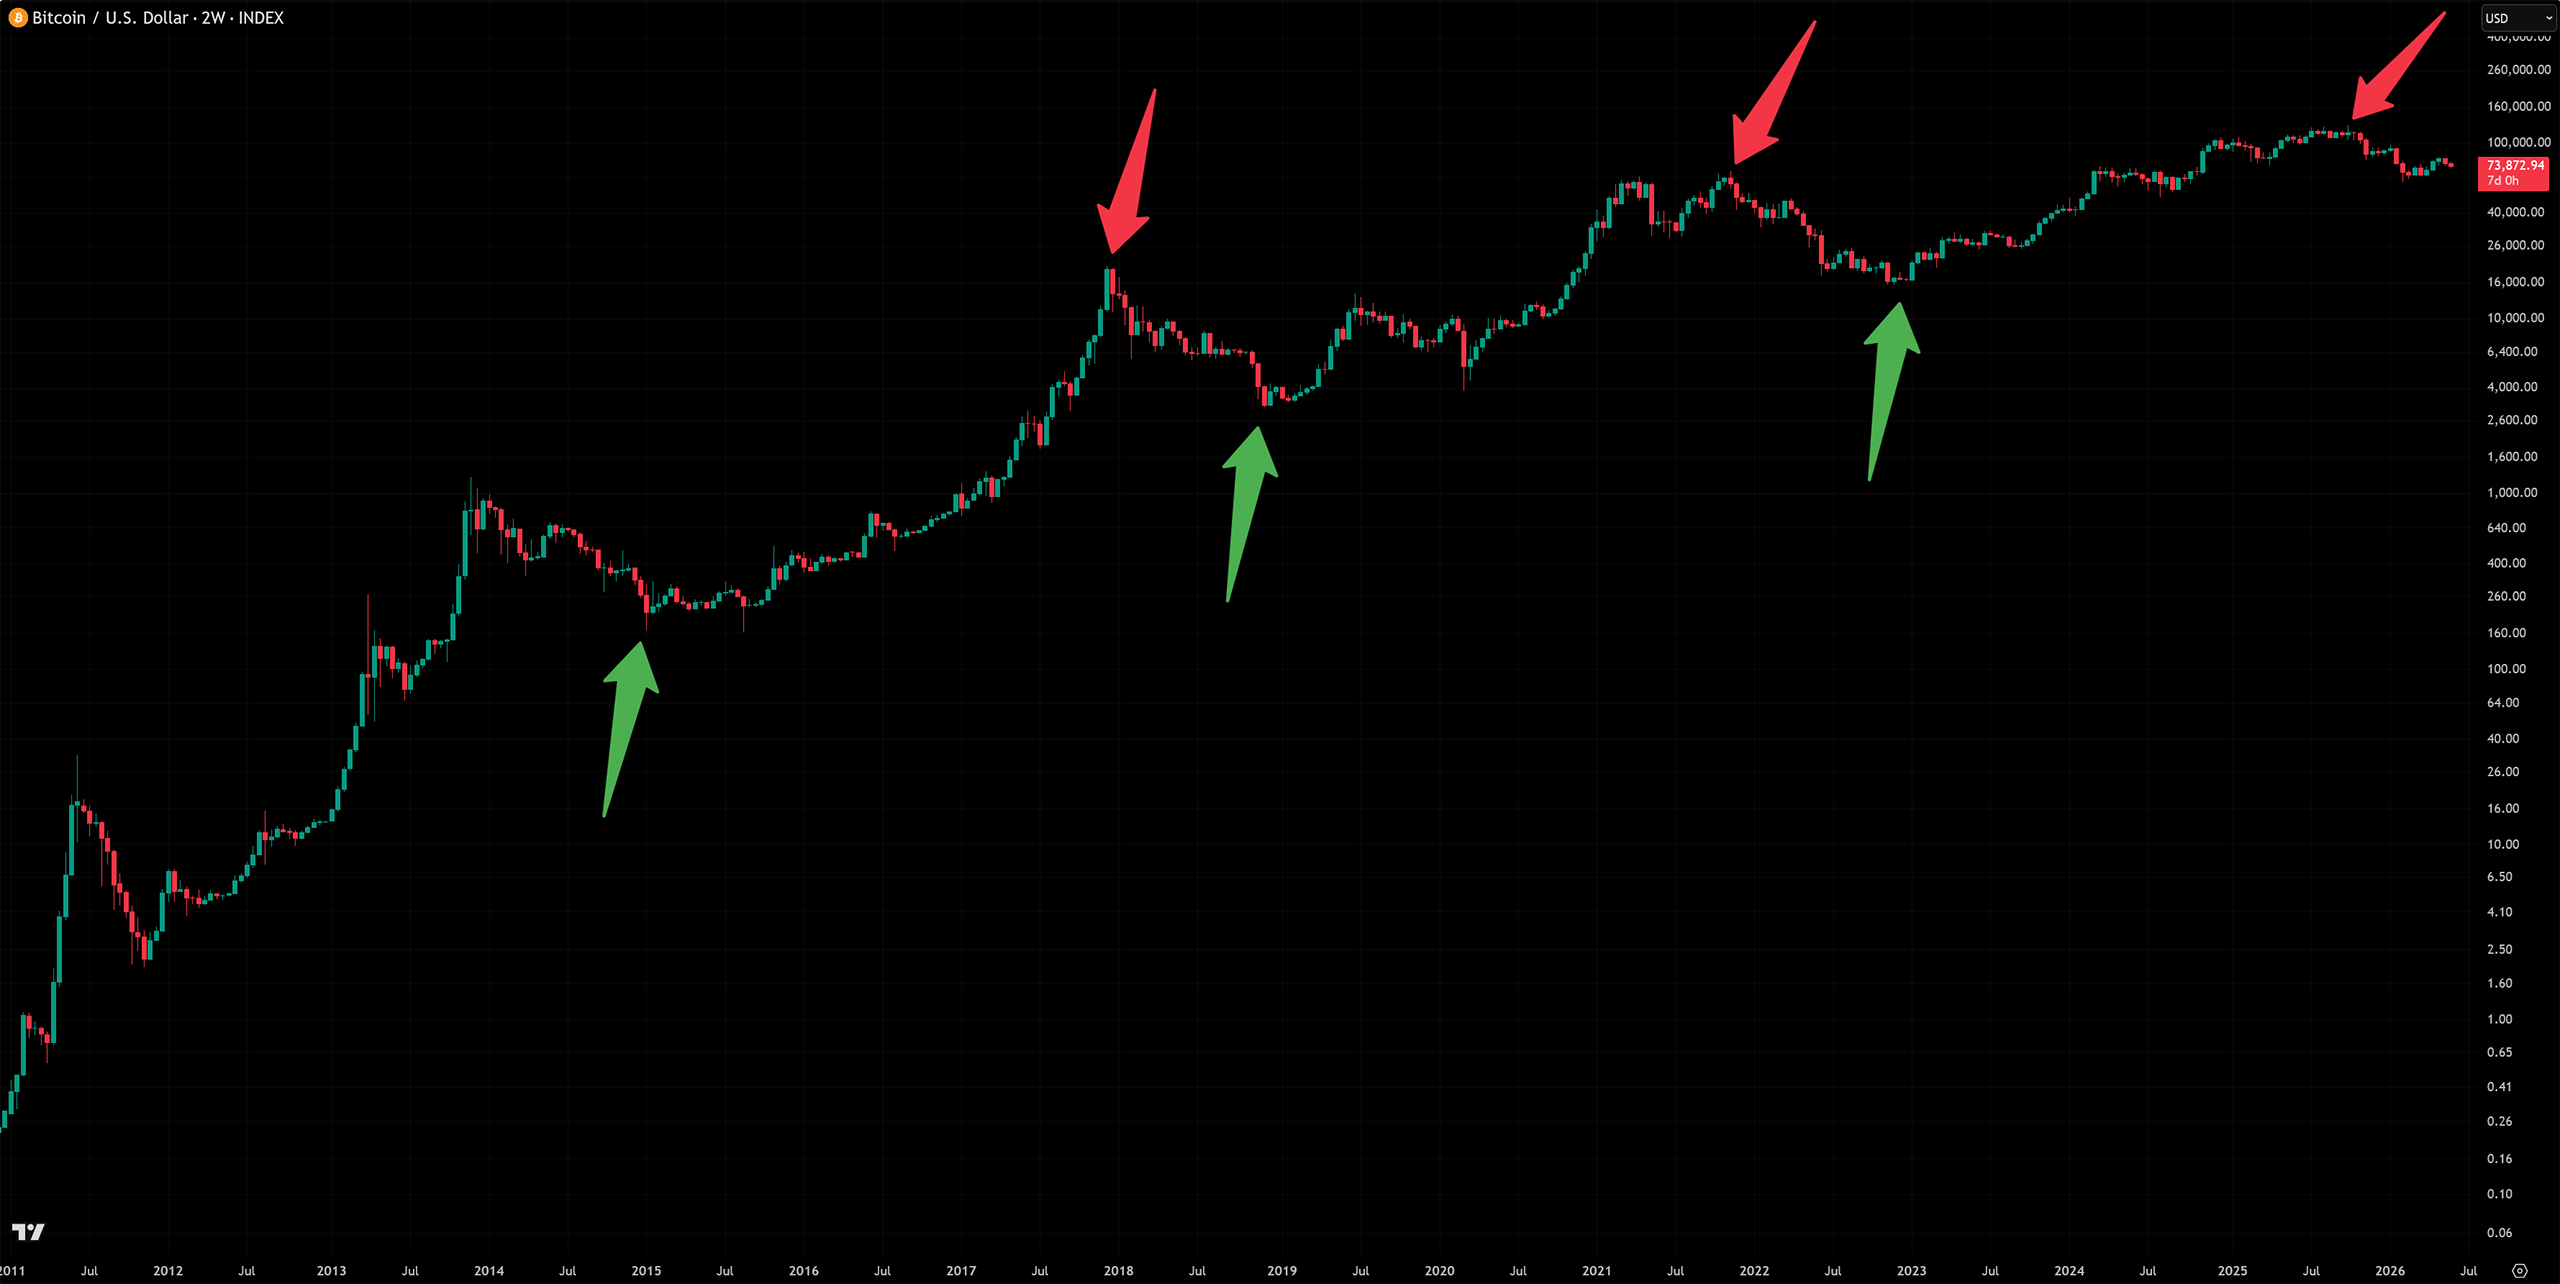
About The Time-Based Chart
The Bitcoin time-based chart shows the exact times in the 4-year cycle of when to buy and sell.
The arrows represent:
- Green arrows = End of the midterm election year.
- Red arrows = End of the post-halving year.
Technical Analysis
I say it to everyone in our trade group; Bitcoin does the exact same thing every 4 years with diminishing returns. You almost can’t lose trading the 4-year cycle this way.
To keep things simple, you don’t need tons of different indicators and charts to win at Bitcoin.
Just follow the time-based solution, and you will win every time. All you have to do is buy Bitcoin at the end of midterm election years and sell it at the end of post-halving years. Simple as that.
Look up at the chart I posted above, and you will see exactly what I’m talking about.
Further Analysis
This is one of the reasons I’m feeling confident, we see a bottom forming in the 4th quarter of this year. October, to be exact. October to January is the worst-case scenario.
The value of sharing this is, “What time of year are we running up on?” It’s a midterm election year. We’re closing in on the time-based solution, which says “October-December.”
I will always trust the old faithful time-based chart. This simple solution never misses!