
Everyone’s asking, “When will we see Bitcoin form a bottom this cycle?” This is one of the charts I watch that has consistently nailed the Bitcoin bottom since its creation.
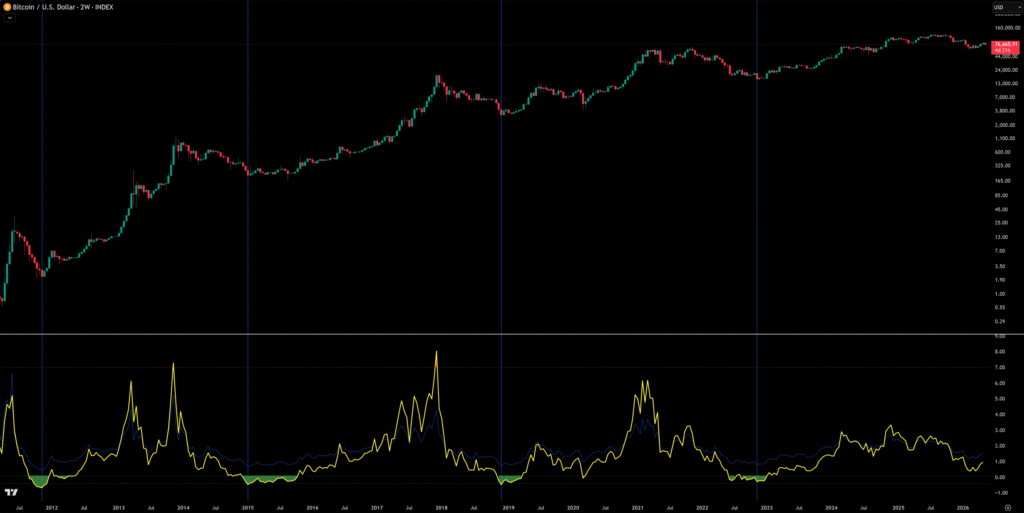
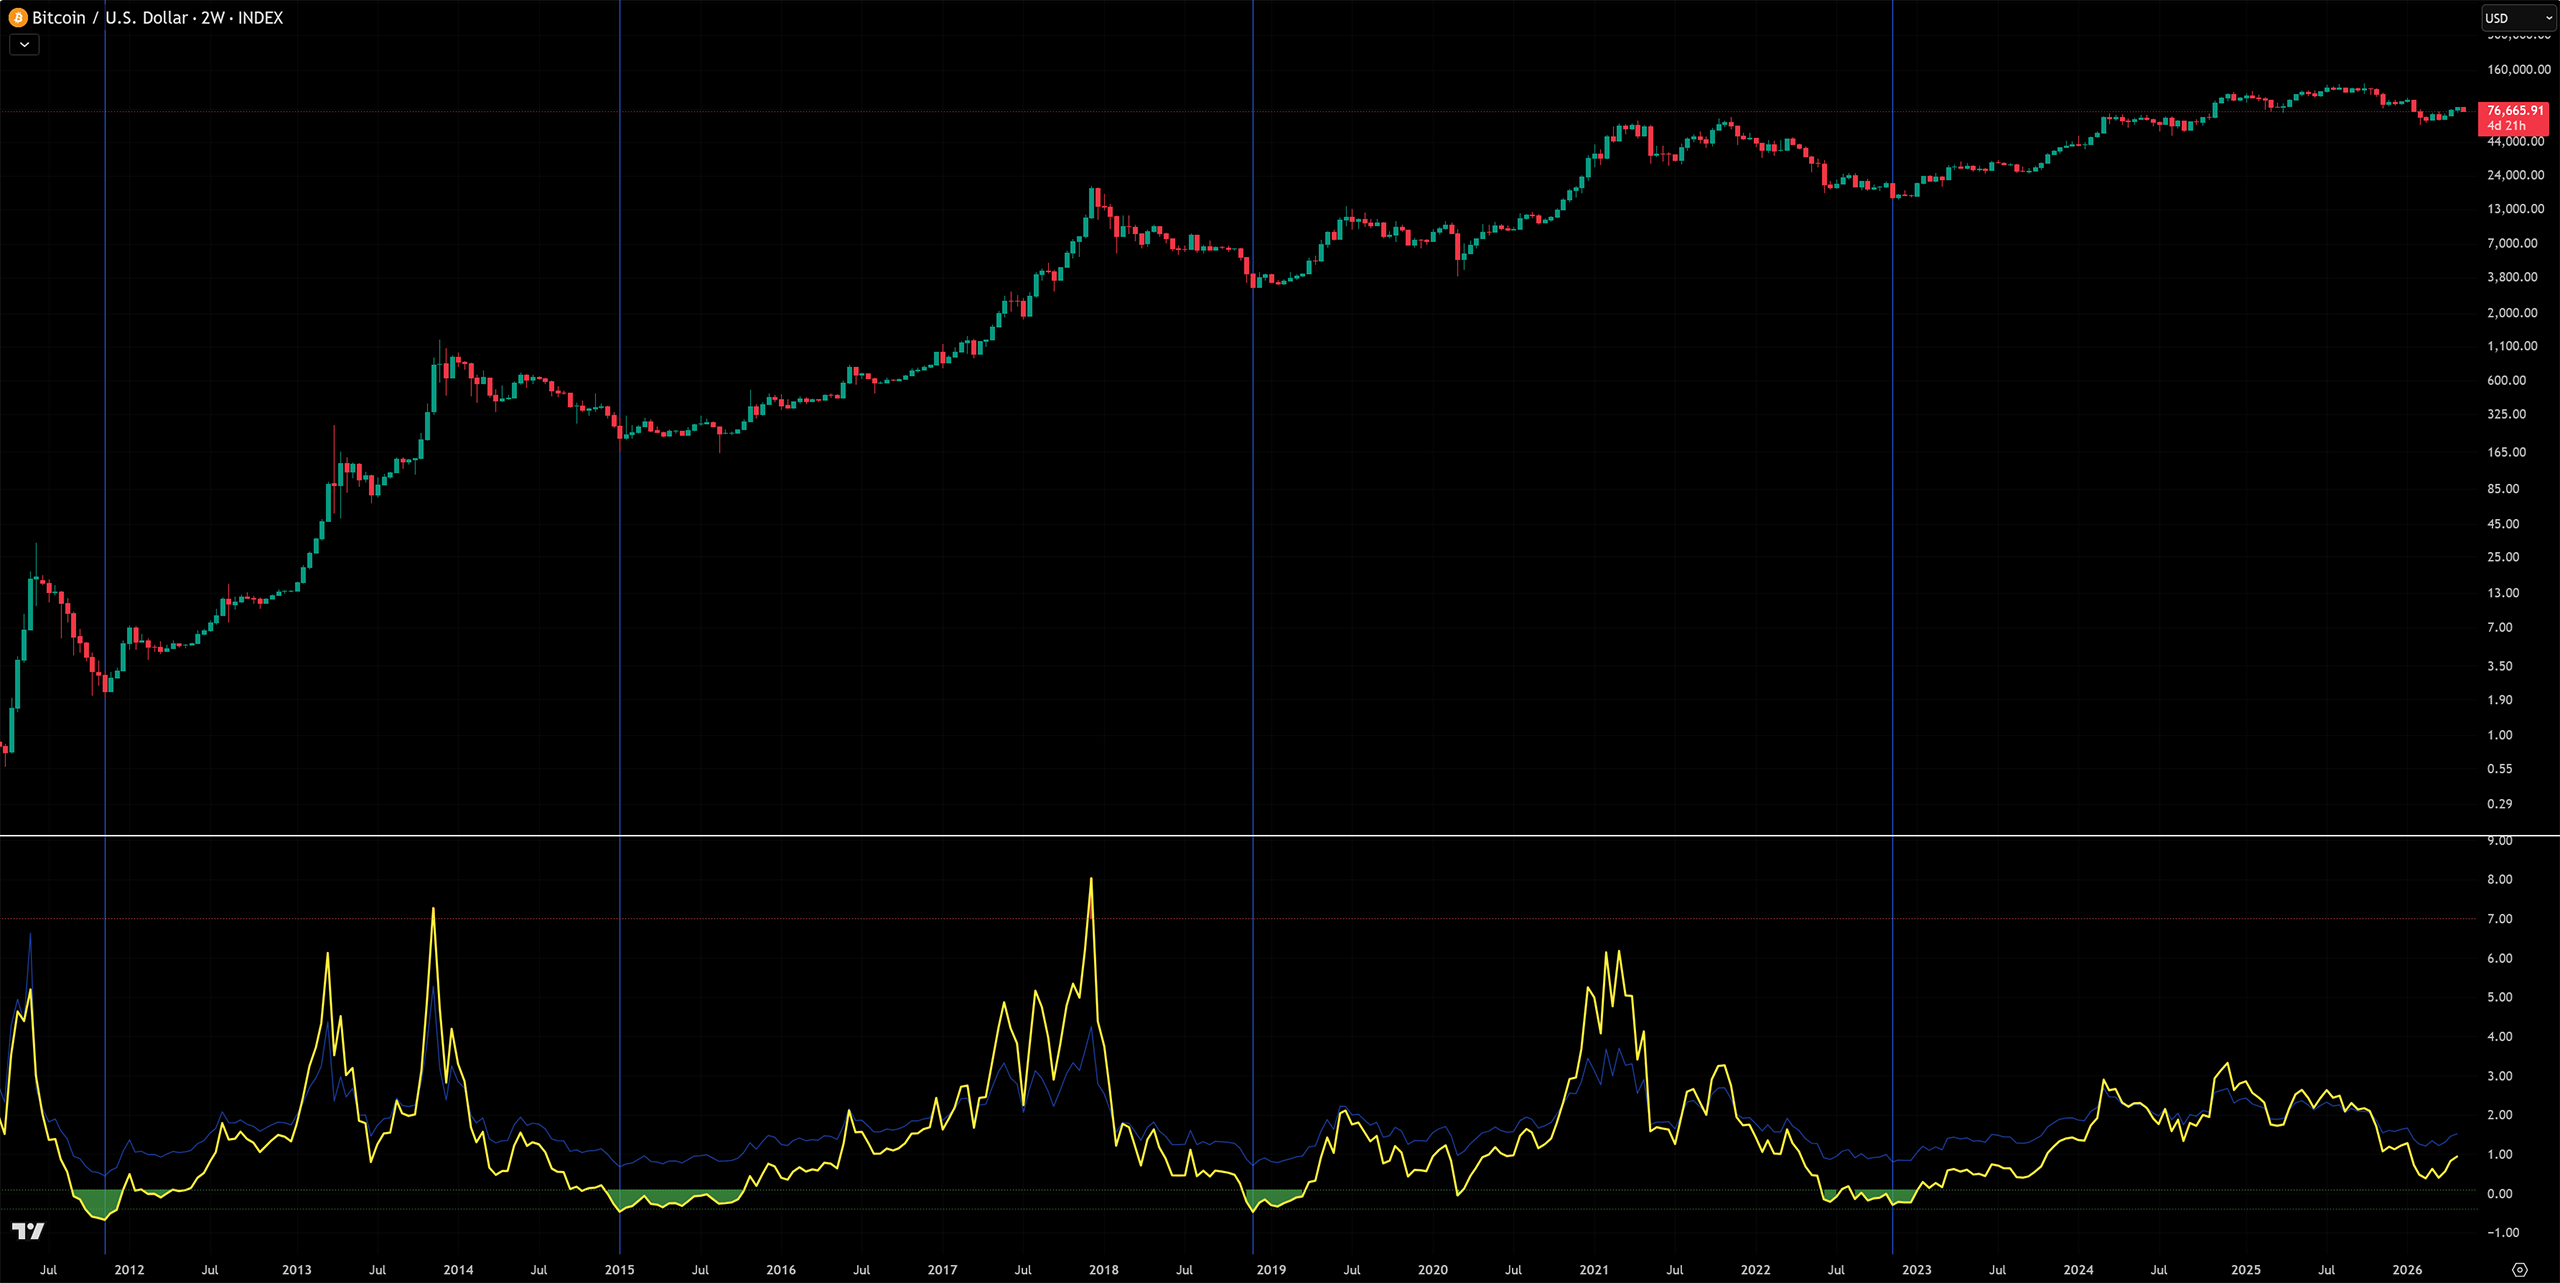
Download, zoom in, and look through the history of this chart to see how accurate it is.
Chart Information
The Bitcoin 2-week chart above shows 2 important details:
- Bitcoin price action (top)
- MVRV-Z indicator (bottom)
MVRV-Z: Green represents the fair value of Bitcoin. I call this the buy zone.
Green = fabulous buying opportunities.
I’ve added blue vertical lines marking the bottom of each 4-year cycle to help you see the pattern between the different 4-year cycles.
If you do not have TradingView set up. Here’s a link to the same chart using the same MVRV-Z indicator on Bitcoin Magazine’s website. You’ll want to keep an eye on this chart if you’re looking to buy around the bottom.
Analysis
The MVRV-Z indicator, compared to Bitcoin price action, is a powerful chart to look at.
I’m looking at around late September to October for a bottom to start forming. Bitcoin bear markets on average last about 1 year. There has been only 1 cycle in which the bear market lasted slightly over a year. Knowing that I would be on the lookout between October and January.
Here is a chart I put together showing the probability of when the bottom will occur.
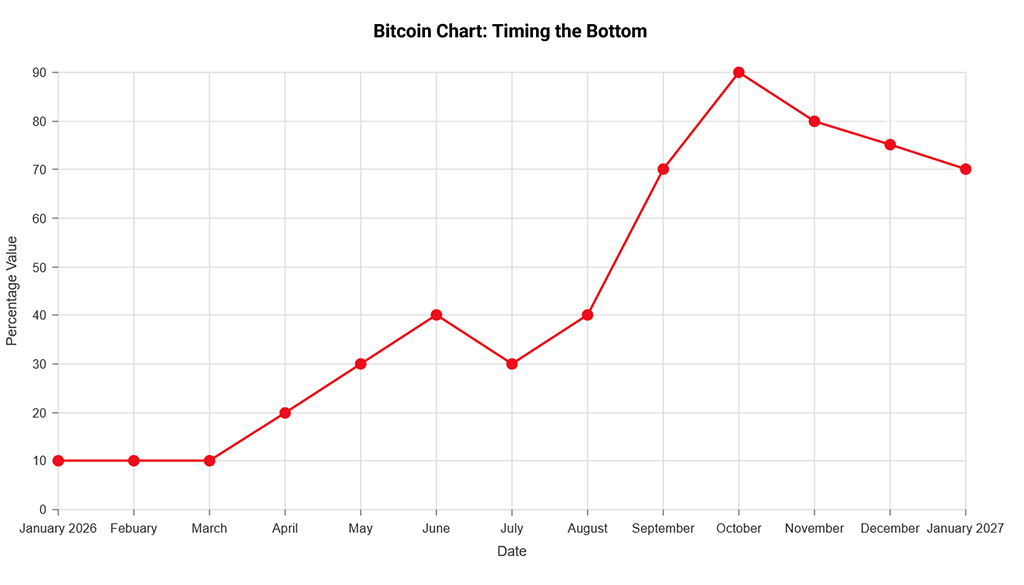
We’re due a bottom, currently almost 7 months into the bear market. Based on history, odds are high that we see a bottom near October this year. My projections say we have 1 or 2 more legs down.
Currently, the MVRV-Z score is around .98-1. My preferred buy zone is below zero in the green, closer to -0.30.
This should put Bitcoin in the price range of 33-42K.
I’ll be patiently waiting for the bottom. If you follow the website or are in my trade group, you’ll be the 1st to know when we find bottom.