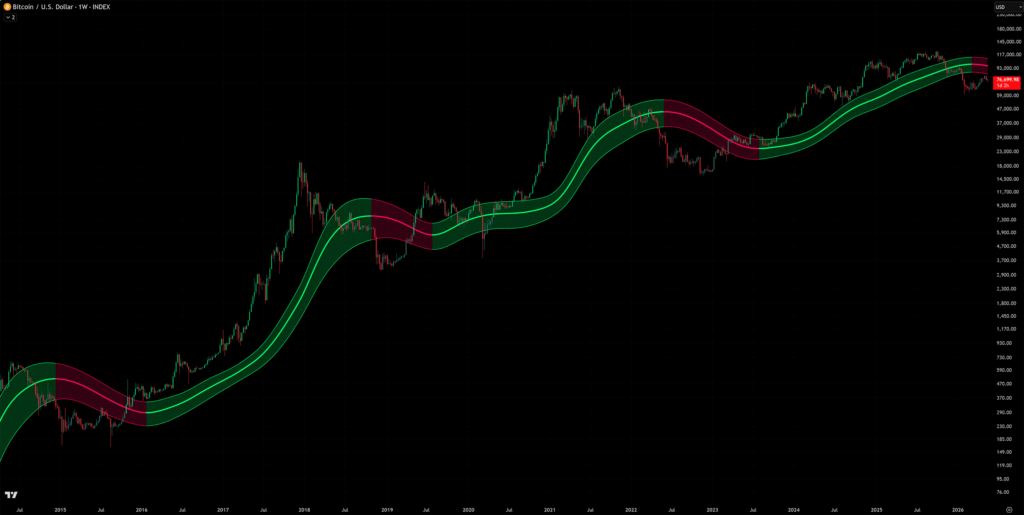
As of March 9th 2006, the Bitcoin Gaussian channel chart has switched from bull market (green) to bear market (red).
Below is a current snapshot of the Bitcoin 1-week chart using the Gaussian channel indicator. This chart shows the history of Bitcoin all the way back to 2014. Download and zoom in on the chart.
Gaussian Channel Information
The Gaussian channel is the red and green bands that follow price action on the chart above.
In bull markets, Bitcoin usually stays above the Gaussian channel. In bear markets, we usually stay below. Once you drop into the Gaussian channel, it’s like standing in quicksand. It’s hard to get out once you’re in. The Gaussian channel indicator is great at identifying long-term trends and momentum.
Analysis
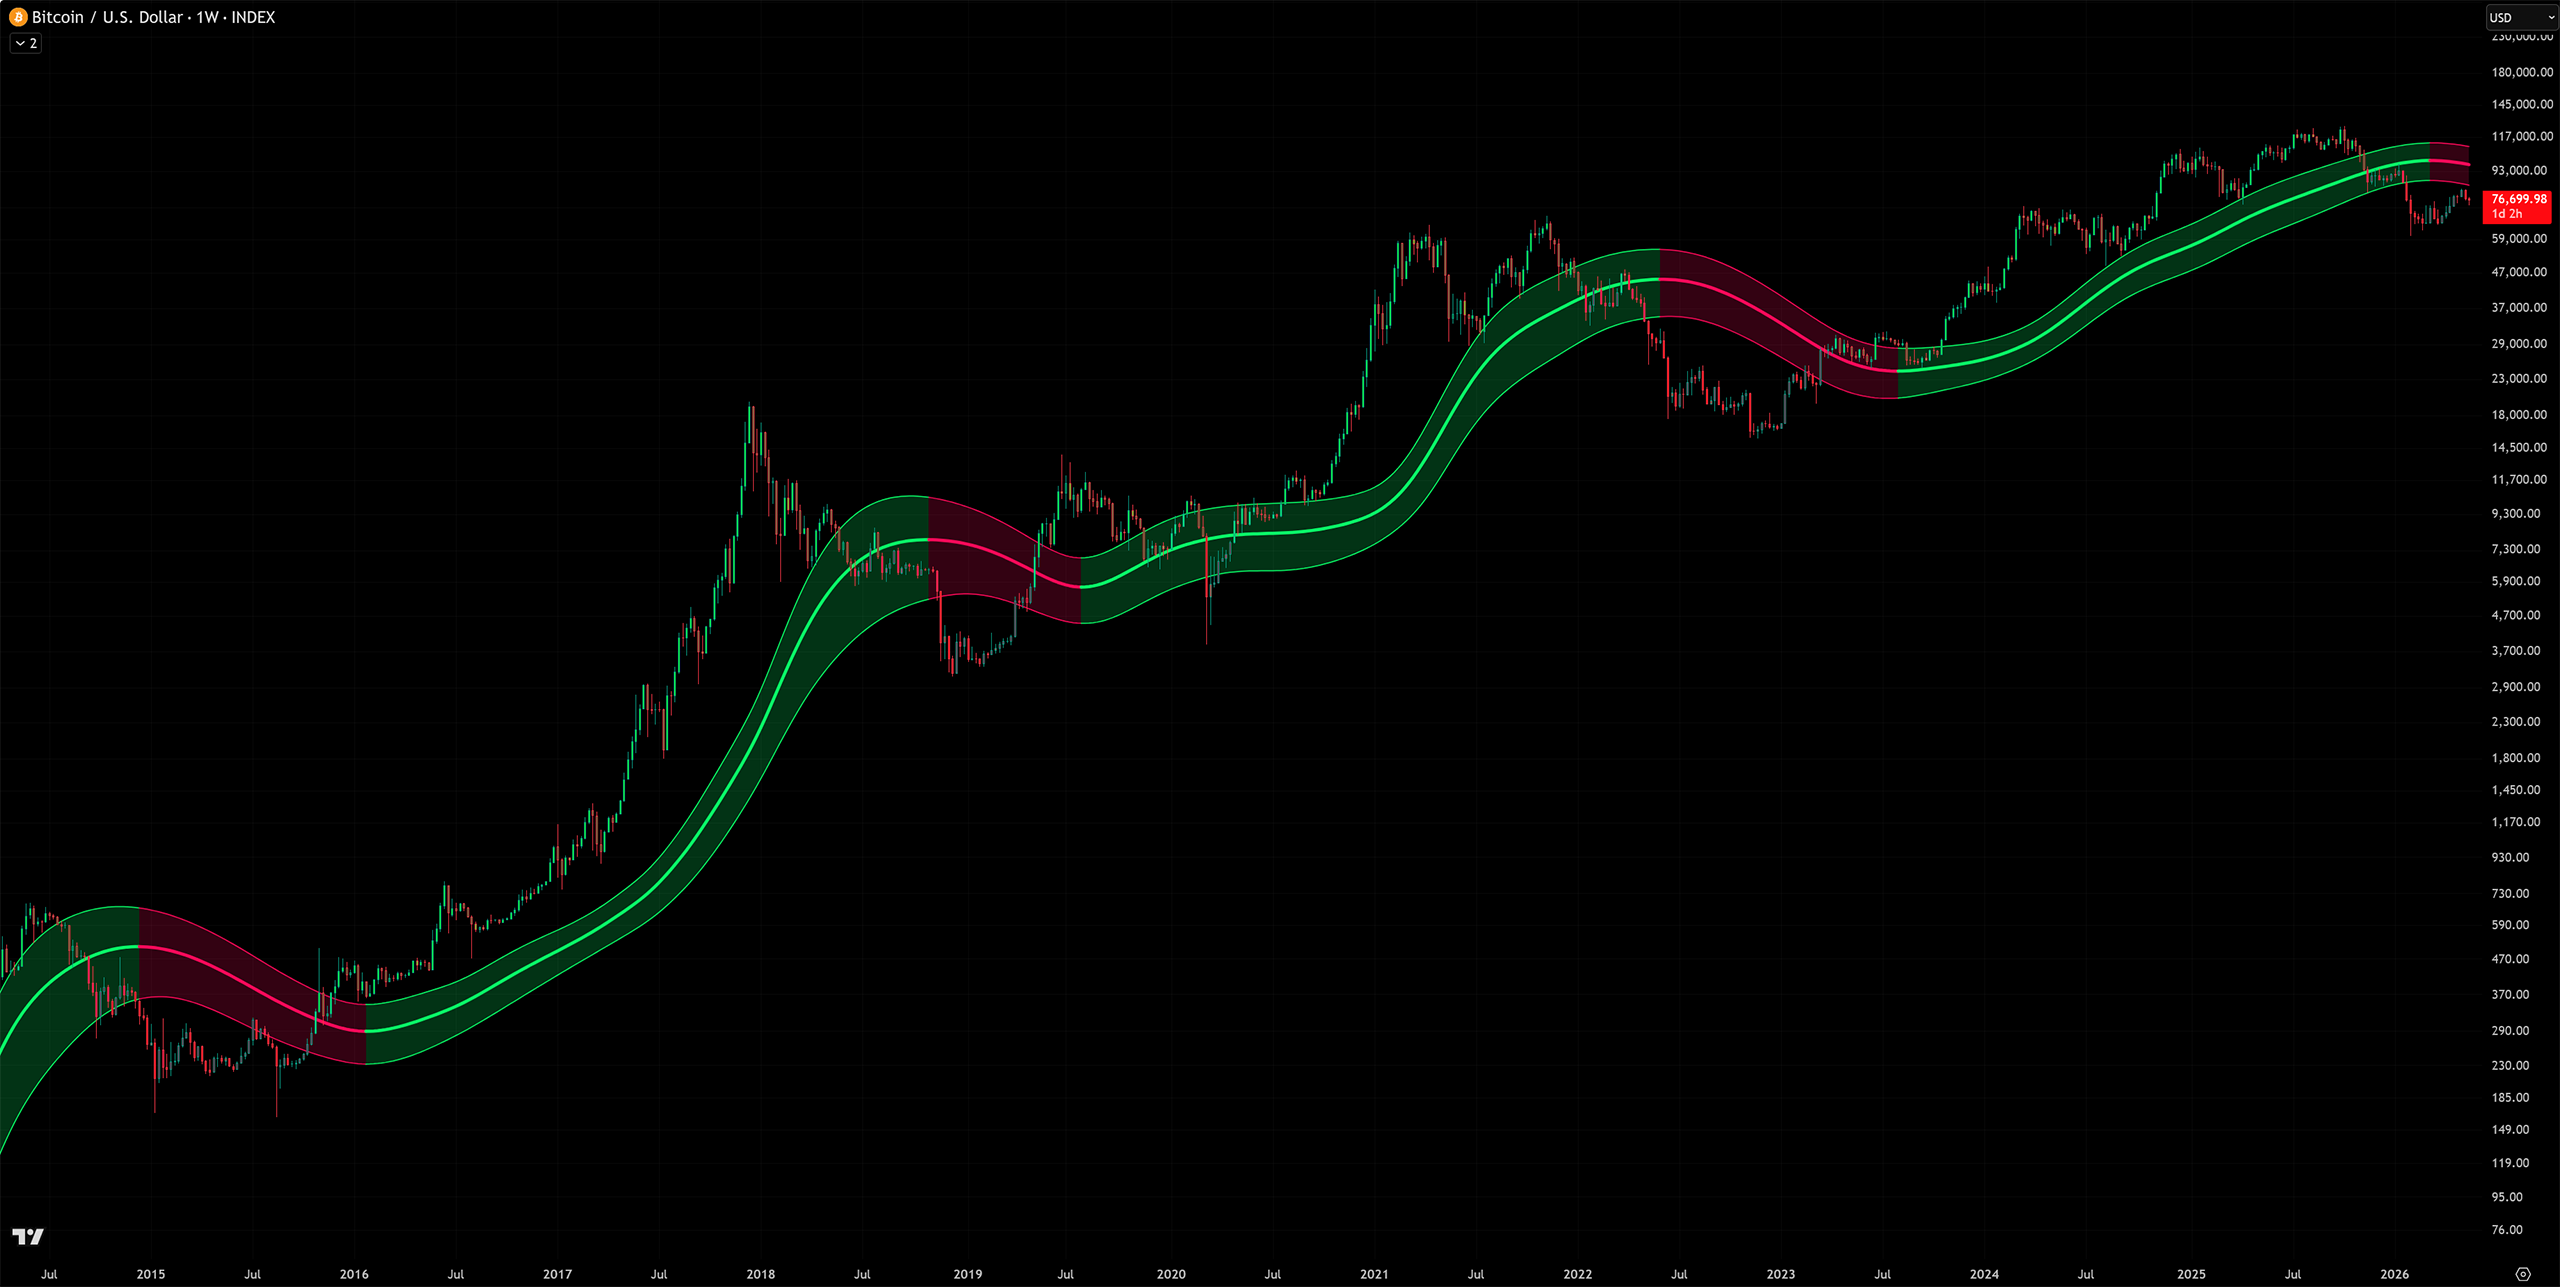
The Gaussian Channel indicator is one of my favorite long-term charts. I use it to identify trends, and this chart clearly signals a bear market.
Looking at the Chart Above to the Right
In the last few weeks, Bitcoin retested the bottom of the Gaussian channel and faced rejection. We’re definitely still in a downtrend. My eyes are on September to October. The only way to break the current downtrend is for Bitcoin to break through 98k. I just do not see this happening with the current rally.
We usually stay in red for several months before carving out a bottom. The good news is that bear markets are where the bottoms are found.
Another Data Point
On average, summertime is not a great time for crypto. Put your seat belts on, be patient, and wait. That’s what I’m doing.