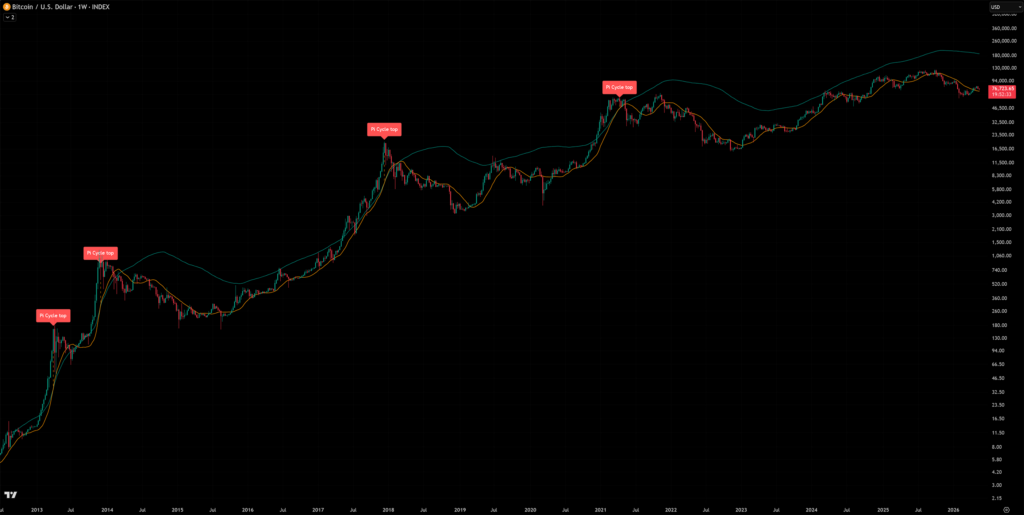
The Bitcoin Pi Cycle top chart has accurately predicted the top of every cycle since Bitcoin was created. The Pi Cycle indicator was known to pick market cycle tops within a 3-day margin of error. That’s all until now.
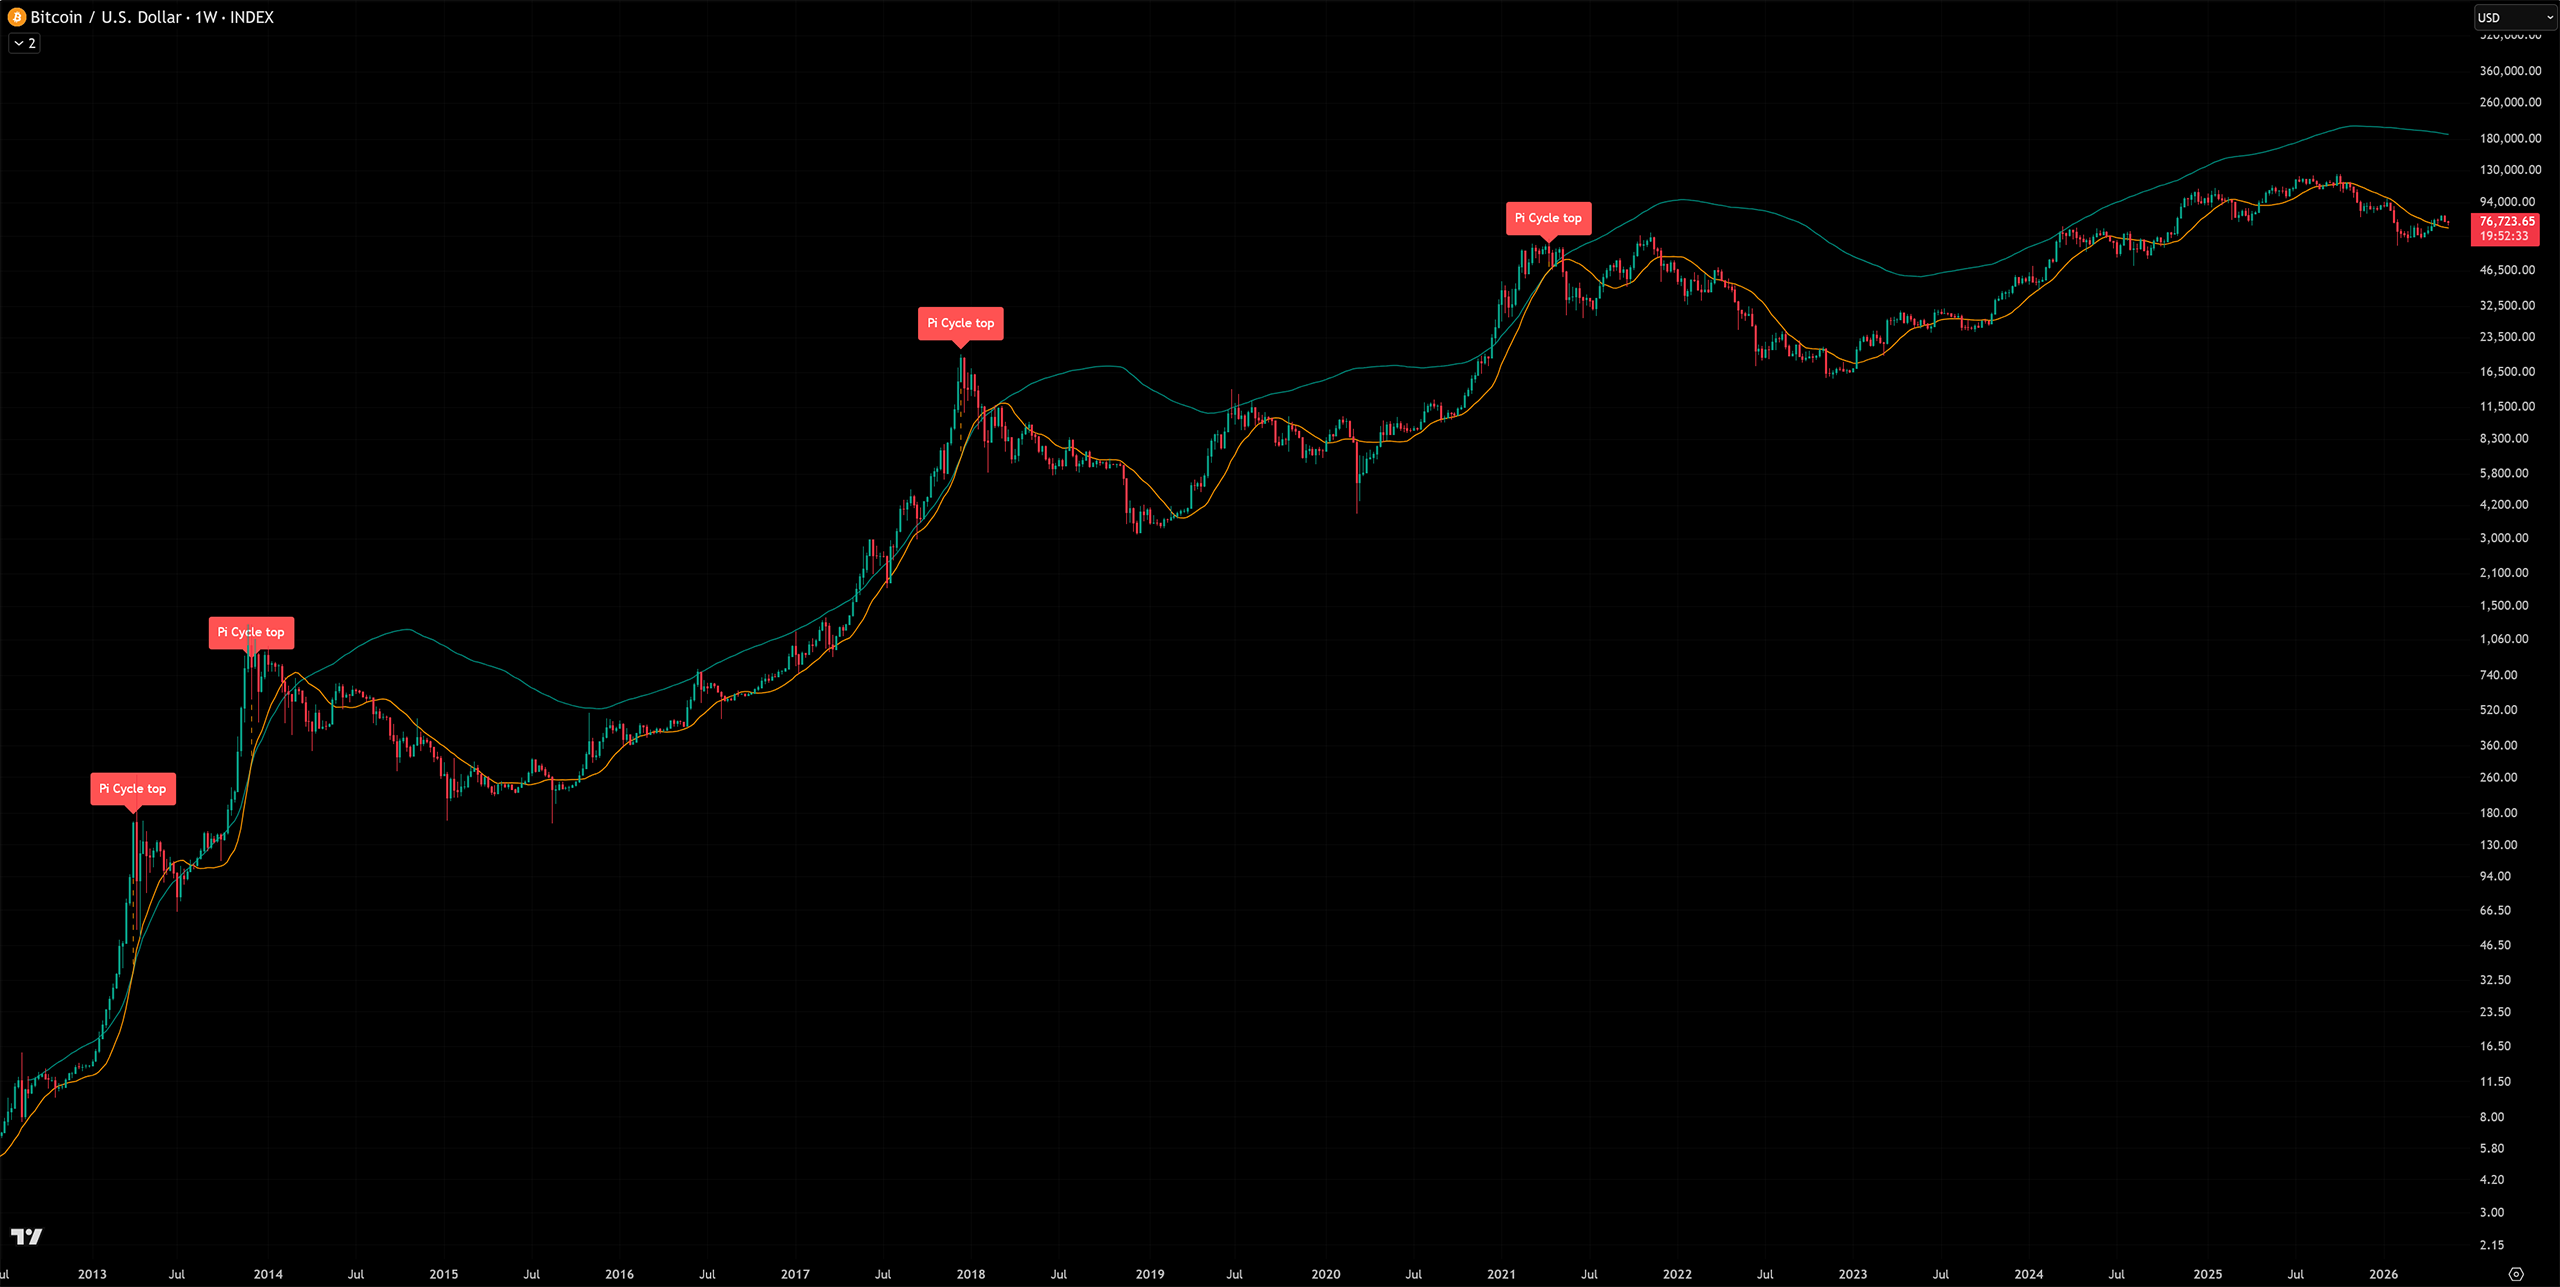
The chart above shows the historical data back to 2012. The Pi Cycle chart/indicator failed to cross and flash a top last cycle. 1st time in history and it missed it big; it wasn’t even close.
Bitcoin Pi Cycle Information
The Pi Cycle indicator uses 2 moving averages:
- 111-Day Moving Average
- 350-Day Moving Average Multiplied by 2
When these 2 lines on the chart cross, that signals the top of that market cycle. Simple as that. If you want to view this chart in real-time. Here’s a link to the same exact chart on Bitcoin Magazine’s website.
Analysis
Now that we have a confirmed top of Bitcoin on October 6th 2025. From here, I highly recommend that you not use this chart or indicator.
I remember everyone in the last cycle talking about this indicator, waiting for it to cross. I guess they’re still waiting because it never crossed.
This is why it’s important to never trust 1 single chart or indicator. From here on, if you hear anyone talking about this chart, you know to take this information with a grain of salt.
The Bitcoin Pi Cycle chart is officially broken, throw it away.
Related Read
Here’s a similar article I just put out discussing the bottom.
When Does Bitcoin Bottom This Cycle?