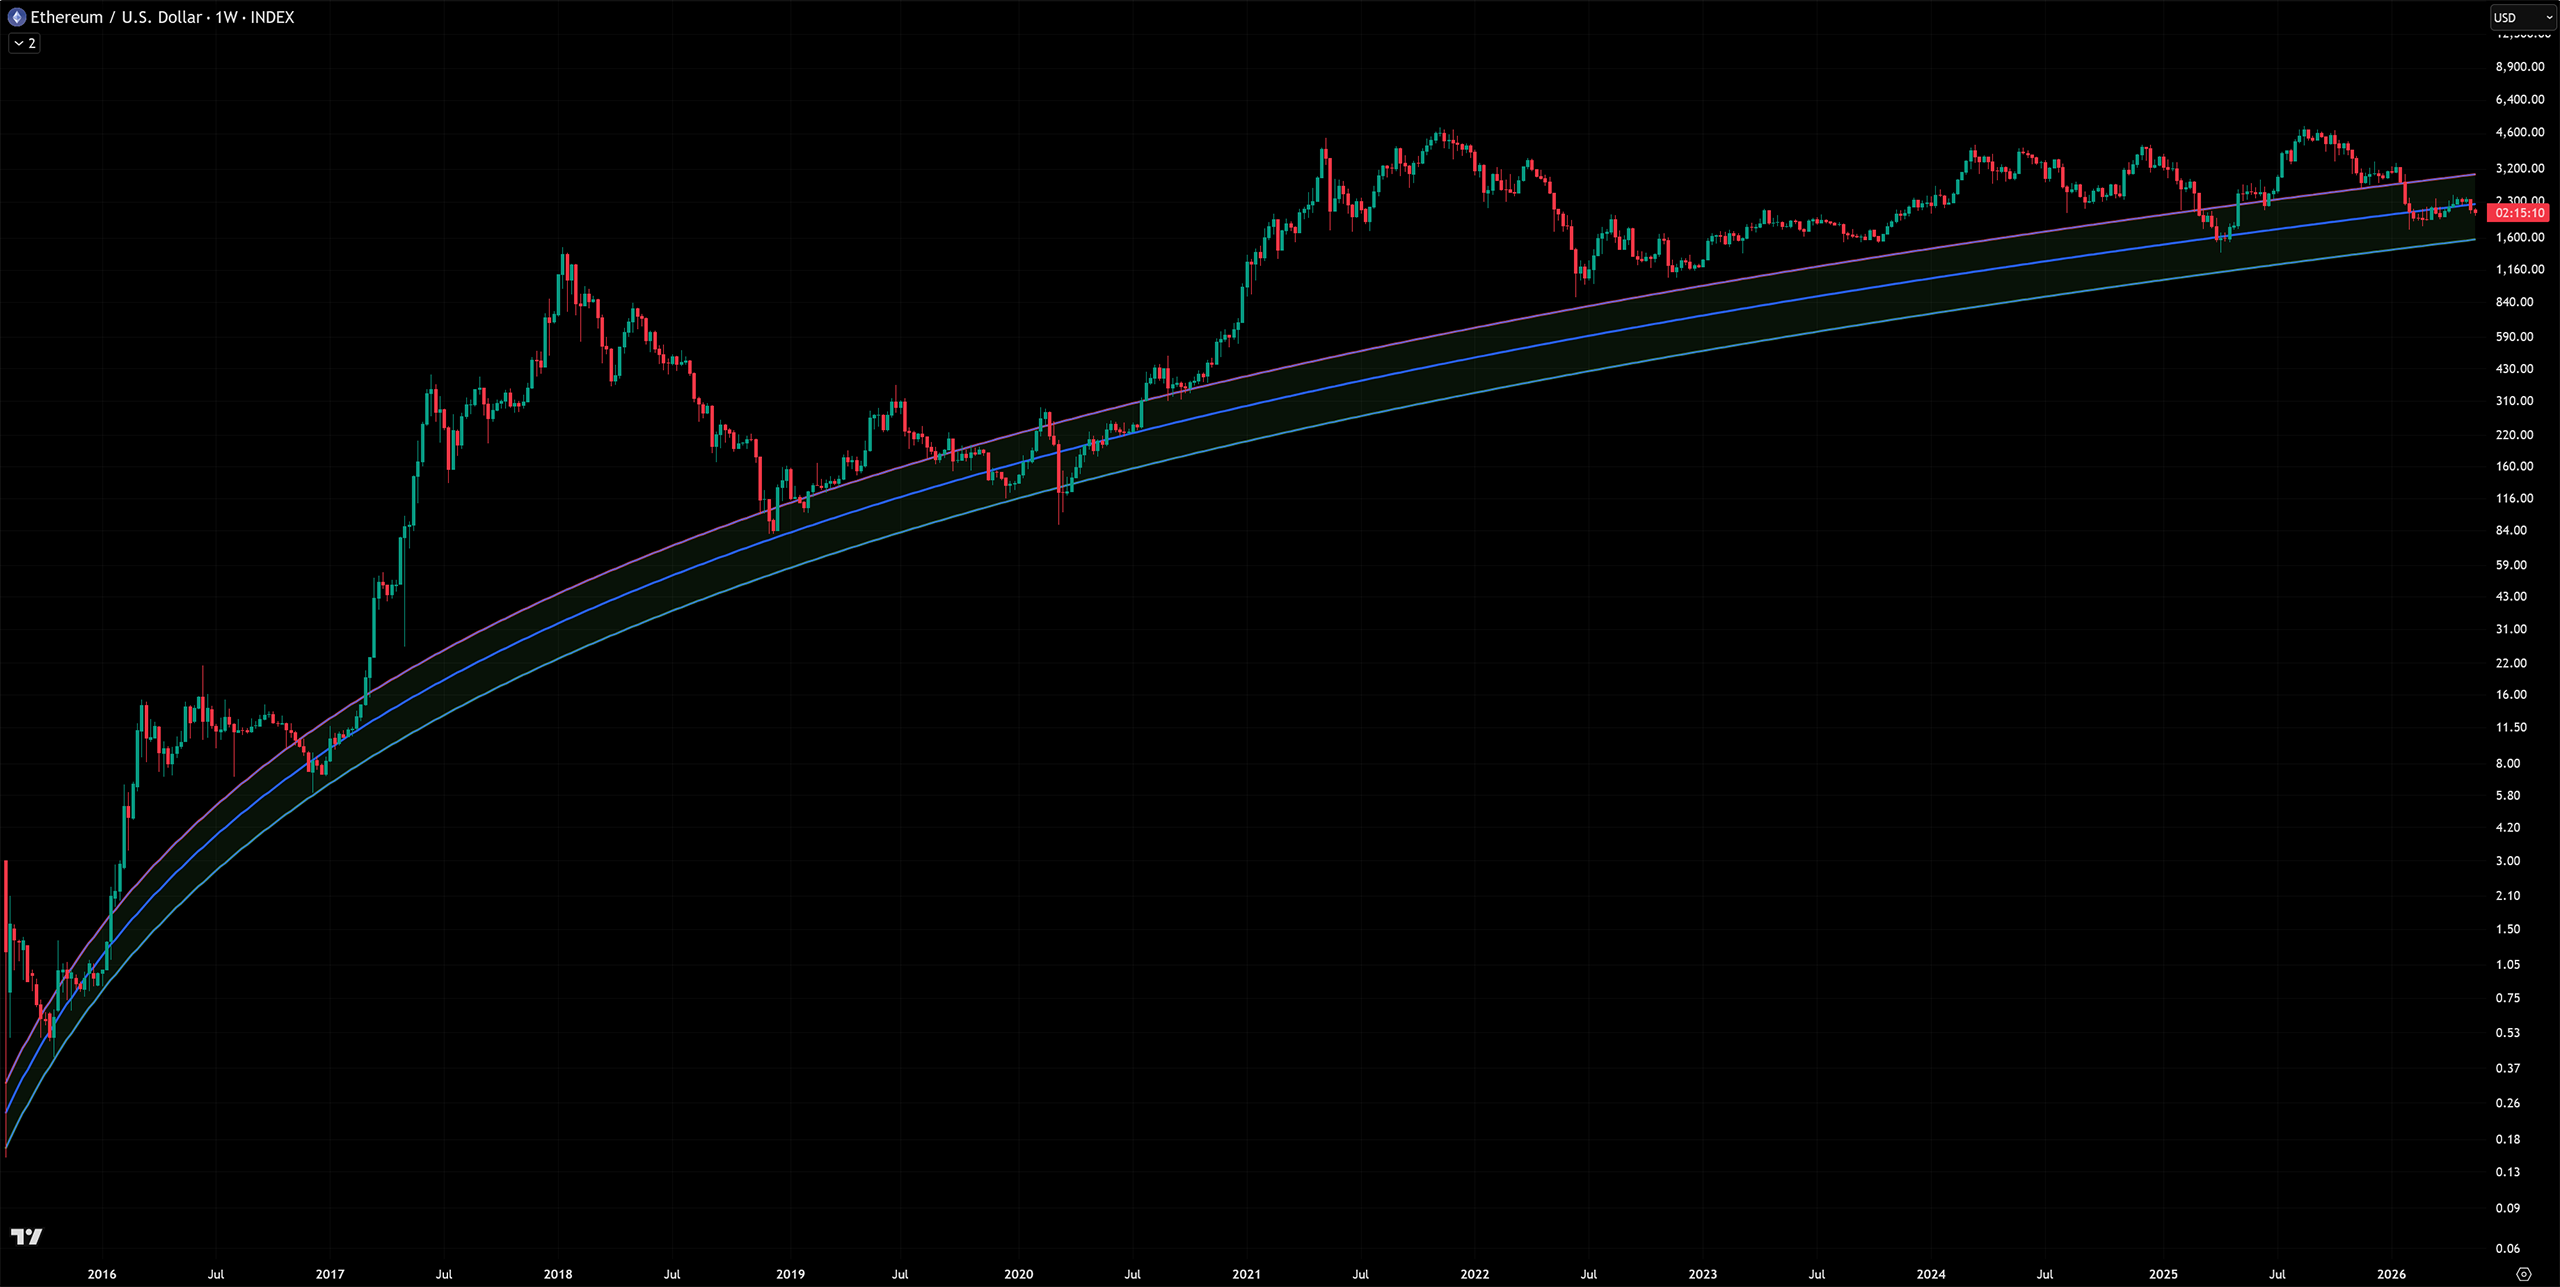
This chart shows the Ethereum logarithmic regression bands on the 1-week chart, all the way back to 2015 when it was launched.

Ethereum Logarithmic Regression Bands Chart Info
The logarithmic regression bands chart is used to estimate long-term price trends.
Chart Explained
The chart above helps with finding the bottom of the market.
- The middle line (blue) is the logarithmic regression line.
- Upper and lower lines (purple and green) provide a range around the main trend.
- This chart focuses on non-bubble data.
Quick Analysis of the Chart Above
I wanted to share this chart 1st since we’re in a bear market and most people are asking, “when bottom?’ This regression bands chart focuses more on the bottom bands and non-bubble data.
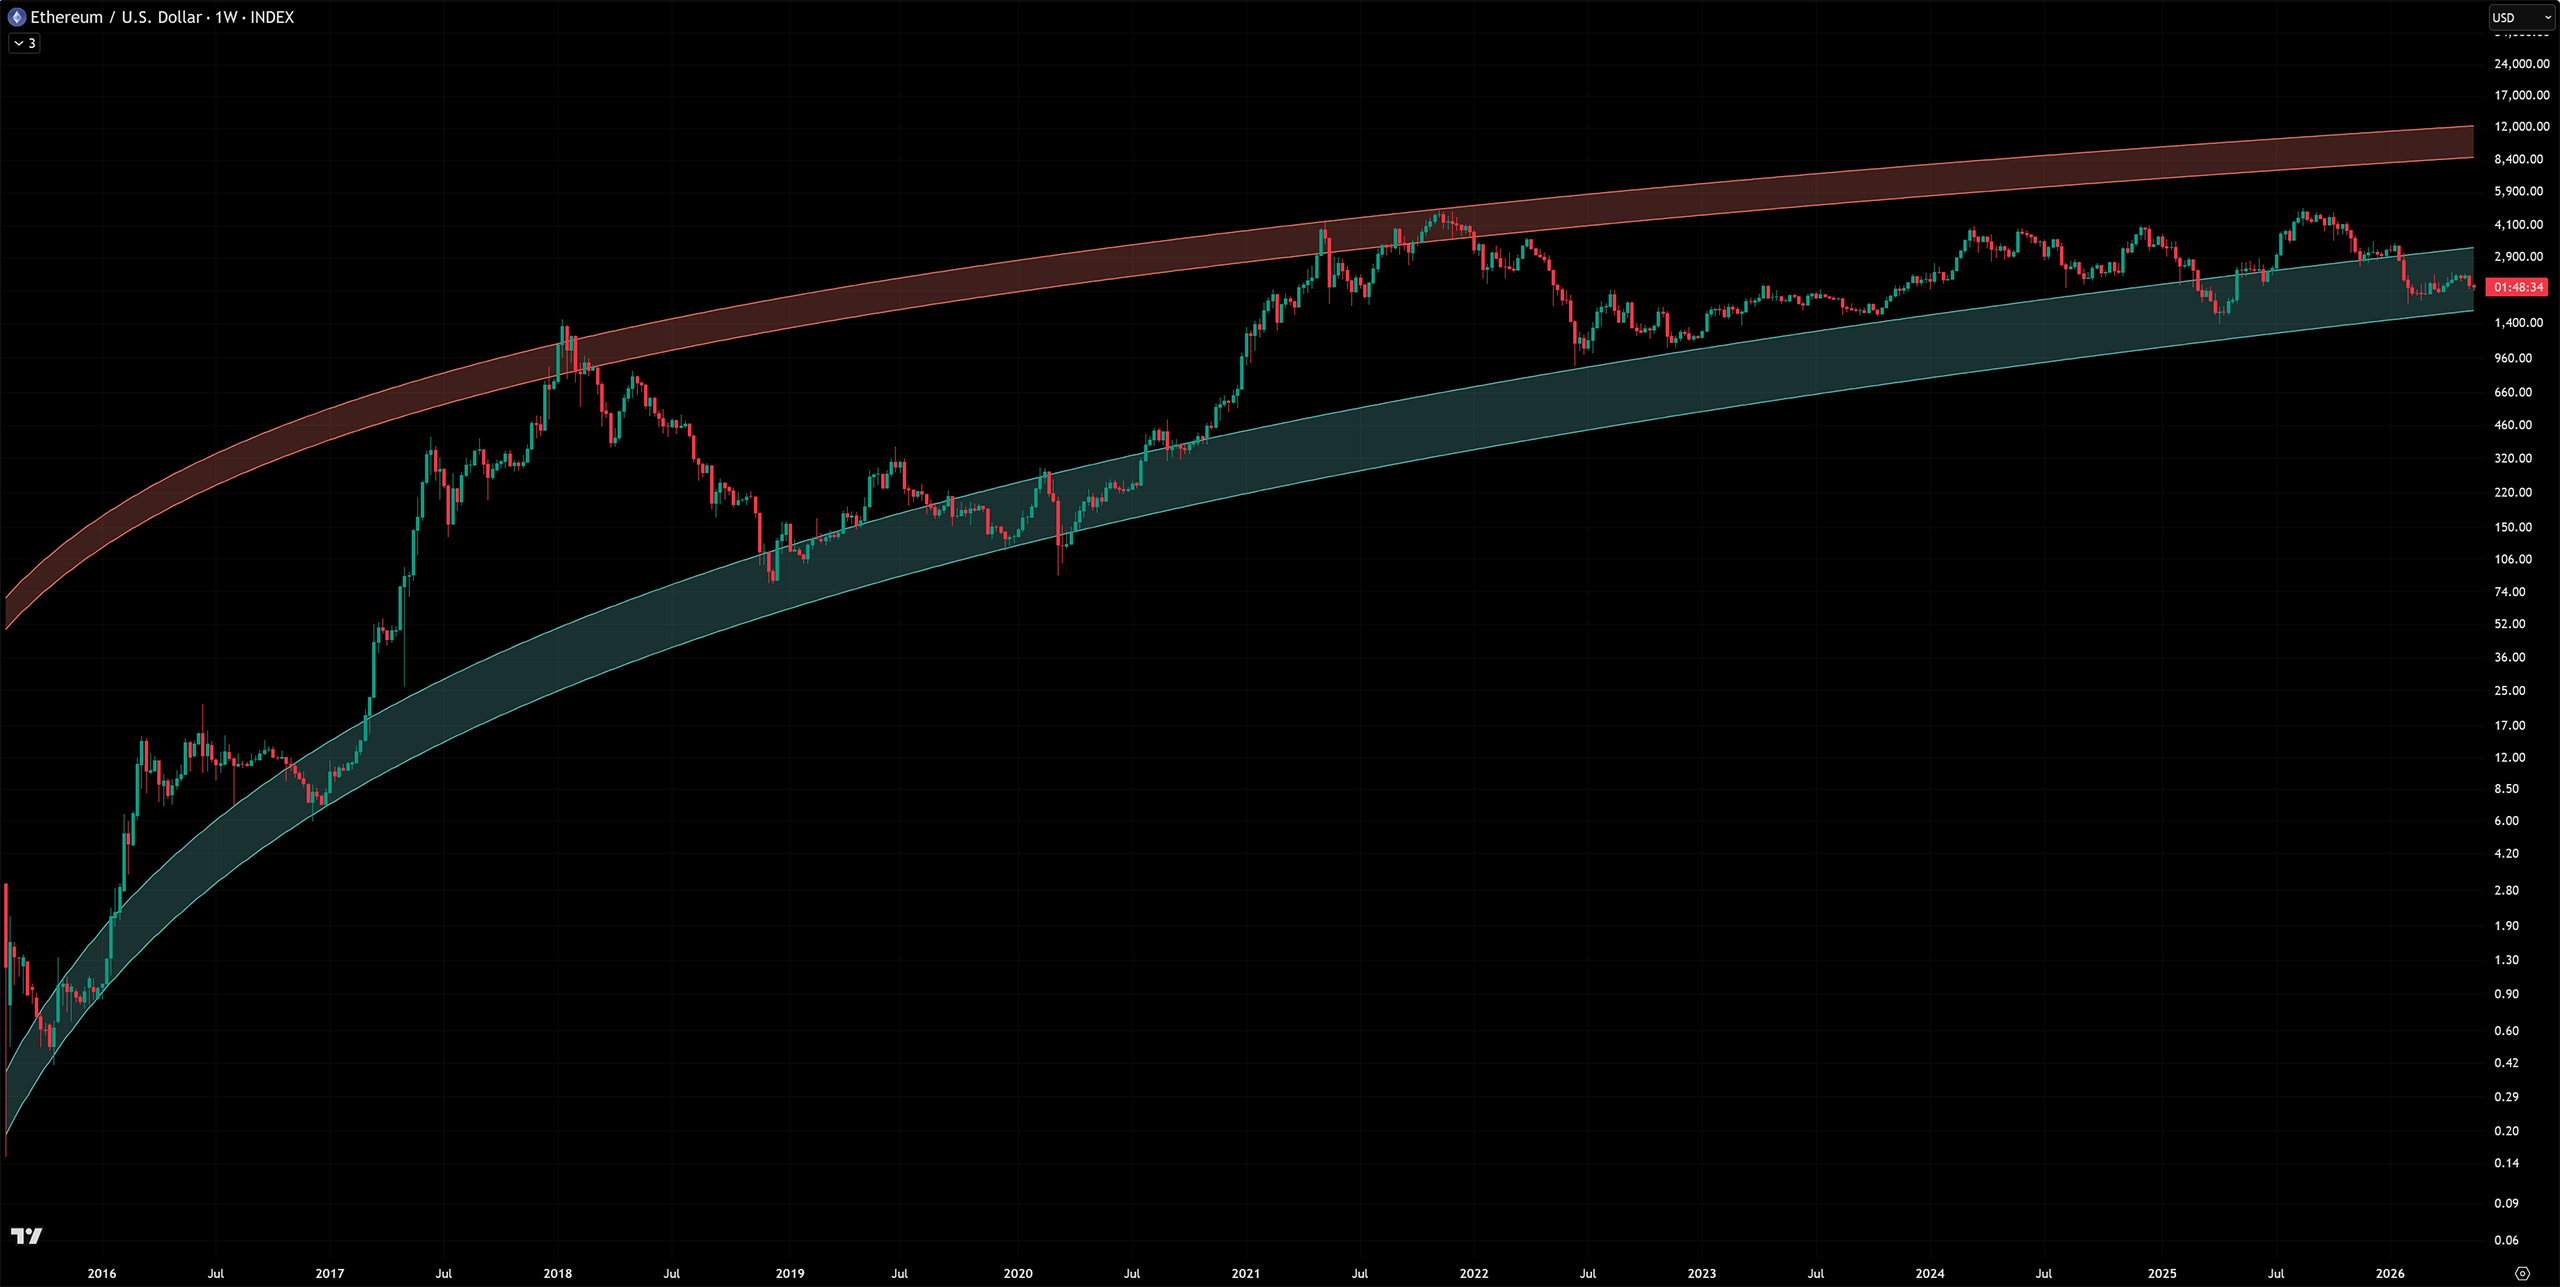
Bonus Chart
Here’s another version of the Ethereum logarithmic regression bands chart. This chart better shows both the upper and lower bands.
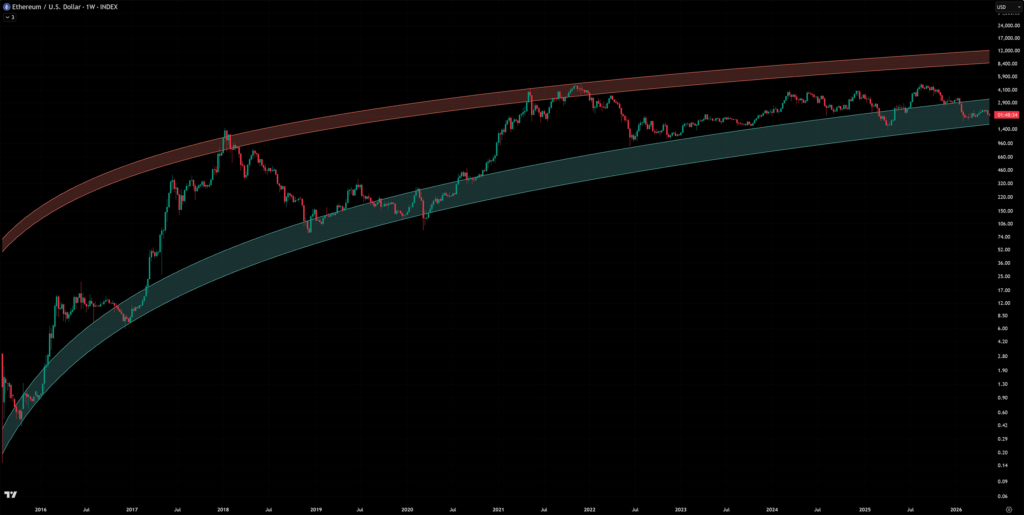
Bonus Chart Explained
- The upper band (red) shows the resistance.
- The lower band (green) shows the support.
Analysis
I like the bottom chart better because it shows 2 bands. This is a good chart to use for Ethereum long-term buying and selling opportunities. Keep this indicator in your toolbox.
If you’re looking for these indicators on Tradingview. Search for “Ethereum logarithmic regression bands.” Here’s the link to this exact chart I use on Tradingview.
Hunting the Bottom for Ethereum?
Ethereum price levels to watch for (highest probability 1st):
- $1600 – June 6th, 2026, ETH dropped to $1508.00.
- $1250
- $950
Anything below $1600 is a fabulous buying opportunity in my book. As of June 6th, 2026, Ethereum has just dropped below the lower band on both charts. Anything below these bands is what I call the “buy zone.”
With Ethereum, I’m a bear for the rest of the year. At least until the 4th quarter. Stay patient, the deals will come.